BnBRx
Your listing, diagnosed.
Cozy Studio · Pool + Gym + Park | Central FL
https://www.airbnb.com/rooms/SAMPLE001
85
Overall Score
Grade: B
Executive Summary
Listing SAMPLE001 · Cozy Studio · Pool + Gym + Park | Central FL
Listing Completeness
88
B
Competitive Position
N/A
Insufficient Data
Top 3 Priorities
1
Work toward Superhost status - maintain 100% response rate, avoid cancellations.
4 of 20 comps have Superhost. Unlocks search boost.
2
Earn Guest Favorite badge - 16 of 20 comps have it.
Close the rating gap with consistent 5-star experiences.
3
Prioritize guest-experience consistency to lift rating above 4.7.
Below 4.7 is a competitive drag; target repeatable 5-star execution.
Airbnb Category Ratings
Separate from overall star rating
Accommodations
Entire rental unit, 3 beds, 1 bath
Data Sources · Pulled 2026-04-17 · 20 comparable listings · 4 seasonal pricing windows (spring / summer / fall / holiday) · 32 reviews analyzed · 10 photos scored
Amenity Coverage & Gaps
Score: 25/25 · 44 available · 3 not included
BathroomHair dryer, Shampoo, Conditioner, Body soap, Hot water, Shower gel
Bedroom and laundryPaid washer – In building, Paid dryer – In building, Hangers, Bed linens, Extra pillows and blankets, Room-darkening shades, Iron, Clothing storage
EntertainmentTV
FamilyOutdoor playground
Heating and coolingAir conditioning, Heating
Home safetySmoke alarm
Internet and officeWifi
Kitchen and diningKitchen, Refrigerator, Microwave, Dishes and silverware, Freezer, Stove, Oven, Coffee maker, Wine glasses, Toaster, Trash compactor, Dining table
OutdoorOutdoor furniture, Outdoor dining area, BBQ grill, Sun loungers
Parking and facilitiesFree parking on premises, Free street parking, Pool, Elevator, Gym
ServicesPets allowed, Self check-in, Building staff
Not includedEssentials, Carbon monoxide alarm, Private entrance
Critical Amenity/Safety Gaps
✗ Carbon monoxide alarm not included - Critical when gas/laundry combustion risk is present.
℞ Amenities You Could Add
| Amenity |
Booking Impact |
Dedicated workspace | High - strong filter for remote workers; desk + lamp ~$100–300 |
Crib / Pack 'n Play | Medium - unlocks family filter; ~$50–150 |
High chair | Low–Medium - pairs with crib for families; ~$30–80 |
First aid kit | Low–Medium - safety best practice; ~$20–40 |
Kitchen staples kit | Low–Medium - appreciated for any stay with cooking; ~$25–35 |
Board games / cards | Low - good for families and rainy days; ~$20–50 |
Power strip / USB hub at nightstand | Low - increasingly expected; ~$15–25 |
Luggage rack | Low - small convenience item; ~$20–40 |
✓ Check-in: after 3:00 PM
✓ Check-out: before 11:00 AM
• Access: Self check-in with building staff
• 3 guests maximum
• Pets allowed
• No parties or events
• Commercial photography allowed
• No smoking
• Additional rules
Photo Audit
Score: 77/100 (C) · First 10 photos analyzed

4 issues
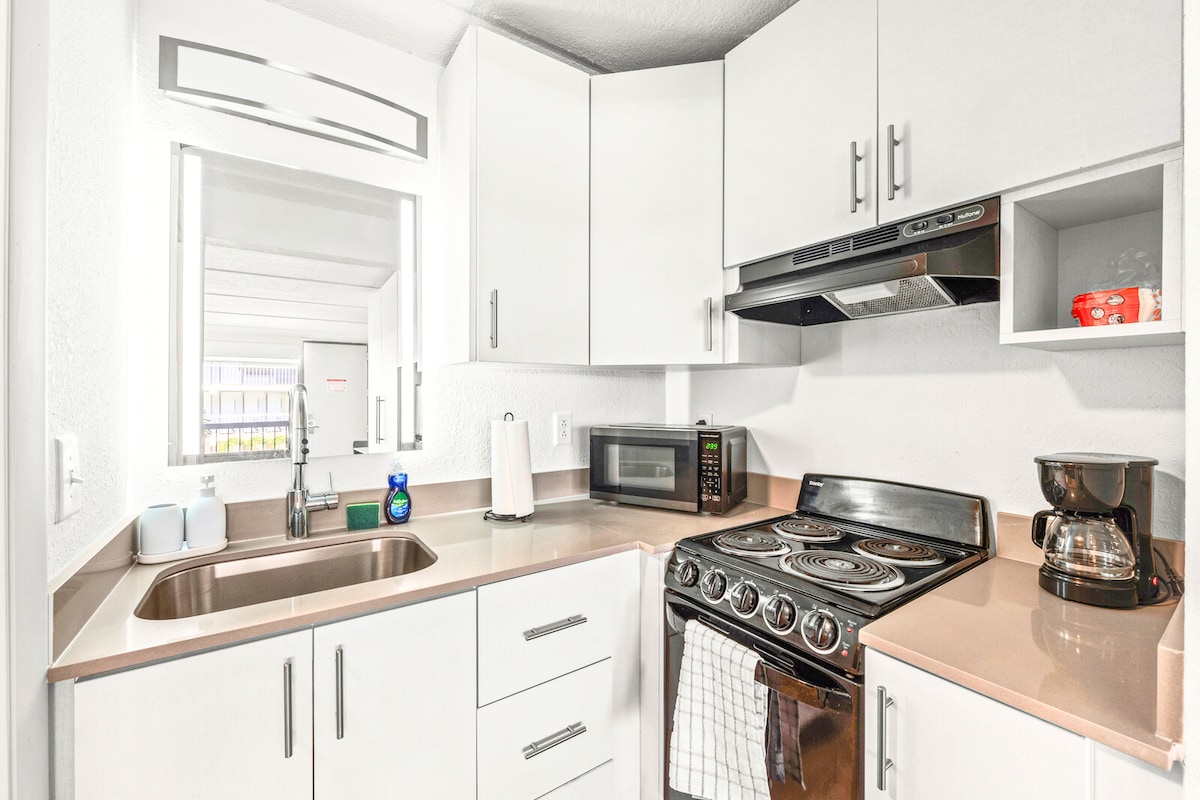
Kitchen
Cover Photo Assessment
Current cover shows a Kitchen interior. Good choice - showcasing main living spaces upfront works well. Note: Cover photo has 4 issue(s) that could be addressed. Top issue: Black appliances contrast with white cabinets — combination reads as dated and slightly mismatched in photos
△ Black appliances contrast with white cabinets — combination reads as dated and slightly mismatched in photos
△ Dish towel on oven handle reduces polish in a hero kitchen shot
△ Overexposed whites reduce perceived quality and detail of cabinetry
△ Tight framing makes kitchen feel smaller than it likely is
Hero Photo Set (First 10)
#1
6.3
Kitchen

#2
7.3
Living Room / Lounge Area

#3
7.7
Studio bedroom/living area

#4
6.0
Studio living/sleeping area

#5
8.3
Studio apartment — open-plan sleeping, dining, and kitchen area

#6
7.3
Studio / combined bedroom and living area

#7
6.3
Living Room

#8
5.0
unknown

#9
5.0
unknown

#10
5.0
unknown
Not Detected in First 10
Exterior/BuildingBathroomDining Area
| Pos | Room | Light | Comp | Stage | Top Issue |
|---|
| 1 |
Kitchen |
7 |
6 |
6 |
Black appliances contrast with white cabinets - combination reads as dated and slightly mismatch… |
| 2 |
Living Room / Lounge Are… |
7 |
7 |
8 |
Floor lamp partially blocks view of wall art - creates mild visual competition with a key decor … |
| 3 |
Studio bedroom/living ar… |
8 |
7 |
8 |
Gray electrical panel on right wall is a visual distraction, partially mitigated by the adjacent… |
| 4 |
Studio living/sleeping a… |
7 |
5 |
6 |
Heavy bokeh hides most of the room - guests can't assess size or layout |
| 5 |
Studio apartment — open-… |
8 |
8 |
9 |
Kitchen area appears darker than foreground - reduces visual continuity across the open-plan spa… |
| 6 |
Studio / combined bedroo… |
8 |
7 |
7 |
Bed cut off at right edge reduces perceived spaciousness |
| 7 |
Living Room |
7 |
6 |
6 |
Living space is too blurred to evaluate - guests cannot assess sofa, layout, or room scale |
| 8 |
unknown |
5 |
5 |
5 |
Could not load image for analysis |
| 9 |
unknown |
5 |
5 |
5 |
Could not load image for analysis |
| 10 |
unknown |
5 |
5 |
5 |
Analysis failed |
Revenue Optimization
20 comps · 2026-05-01 to 2026-05-04
Suggested Range
$143–$188
Your nightly rate unavailable for selected dates - price gap analysis skipped
⚠ Snapshot pricing only - comps reflect 2026-05-01 to 2026-05-04. Season, weekends, and local events can shift rates 30–50%. Monitor comp rates regularly and adjust pricing around high-demand periods.
Price Distribution (Comps)
Your nightly rate was unavailable, so no YOU marker is shown.
Seasonal Pricing vs. Comps
| Season |
You |
Target |
Gap |
| Spring |
— |
$207 |
— |
| Summer |
— |
$115 |
— |
| Fall |
— |
$173 |
— |
| Holiday |
— |
$130 |
— |
Target = comp market median for that season · Gap = your rate minus target · negative means room to raise
Amenity-Driven Pricing
Primary value drivers: shared pool, gym / fitness, BBQ / outdoor grill
Pricing upside appears to come from these core demand drivers plus market timing. Use comp-window checks to decide how aggressively to price above baseline.
Upcoming Demand Events
next 120 days · adjust pricing 2–4 weeks before each event
Peppa Pig - My First ConcertCentral FL, FL
Fri, Apr 17, 6 – 9 PM
CamiloCentral FL, FL
Fri, Apr 17, 8 PM – Sat, Apr 18, 12 AM
Eric JohnsonCentral FL, FL
Sun, Apr 19, 8 – 11 PM
The Academy IsCentral FL, FL
Sun, Apr 19, 7:00 – 8:30 PM
Forbidden KingdomCentral FL, FL
Sun, Apr 26, 12 – 6 PM
WMF: John O’Leary’s Projeto BrasileiroCentral FL, FL
Fri, May 1, 7:30 – 9:00 PM
Central FL Philharmonic - Beethoven Symphony No. 9Central FL, FL
Sun, May 10, 2:30 – 4:30 PM
KRIS RCentral FL, FL
Sat, May 23, 3 – 10 PM
Action Plan
Prioritized recommendations - address in order
1
Work toward Superhost status - maintain 100% response rate, avoid cancellations.
4 of 20 comps have Superhost. Unlocks search boost.
2
Earn Guest Favorite badge - 16 of 20 comps have it.
Close the rating gap with consistent 5-star experiences.
3
Prioritize guest-experience consistency to lift rating above 4.7.
Below 4.7 is a competitive drag; target repeatable 5-star execution.
Optimize title length - target 45–50 characters
Reorder photos - lead with your best exterior or establishing shot
Add a checkout message educating guests that a 4-star review signals a problem on Airbnb — ask them to message you before reviewing if anything wasn't perfect. This is ToS-compliant and one of the highest-leverage tactics for hosts below 4.7.
Medium Effort - This Week
Reshoot any photos scoring below 6/10
Highlight comfort features in description based on guest feedback
Invest in a professional photography session ($200–400) — photos are the single highest-ROI improvement for any listing. Guests decide in seconds, and polished photos convert browsers into bookings faster than any other change you can make.
Review top-performing comparables for amenity gaps
Review top-performing comparables for pricing strategy or consider using dynamic pricing tools.
How Scores Are Calculated
Overall Score Weights
Listing 25% · Photos 25% · Competitive 25% · Reviews 25%
Listing Completeness - How well your listing communicates value to a potential guest. We score your title effectiveness, description quality, amenity coverage, and whether key house rules are filled in.
Photo Quality - Your first 10 photos scored on lighting, composition, and staging. Includes a cover photo critique and flags any key room types that are missing.
Competitive Position - How your listing stacks up against similar properties in your market. Factors in your nightly rate vs. comparable listings, your star rating gap, badge status (Guest Favourite, Superhost), and review volume.
Review Health - A read on the sentiment and depth of your reviews. We analyse the ratio of positive to negative themes, surface recurring praise and complaints, and factor in your total review count.
Scores are directional decision support, not guarantees. Date ranges materially affect comp/pricing sub-scores.
Satisfaction Guarantee
If you didn't get value from this report, we'll refund you - no hassle. Tell us what missed the mark so we can improve.
Market Comparables
Comp Reference Table
20 comparable listings used in your competitive score analysis.
Confidence: MEDIUM
GF = Guest Favorite · SH = Superhost · Prices are nightly rates at time of analysis. · Click listing titles to view on Airbnb.
Competitive Deep Dive
Top 5 Competitor Breakdown
Selected using a blended outperformance score: market fit first, then trust signals (rating, reviews, badges), description strength, amenity breadth, and pricing position.
High-value amenity signals in the top 5
Self check-in ★ 5/5Free dryer – In unit ★ 4/5Free parking on premises ★ 4/5Dishwasher 5/5Private patio or balcony 4/5Central air conditioning ★ 3/5
Likely high-value amenity gaps
- Self check-in
- Free dryer – In unit
- Dishwasher
- Private patio or balcony
- Central air conditioning
- Dedicated workspace
Top Comp #1
distance=1.0mi
80.0
Outperform Score
fit 30.4 · trust 30.0
Guest favorite, Superhost
Badges
Price delta unavailable
Price vs You
Description
406 words, clarity 16/25, location cues 2, trust cues 0.
Why it likely wins
Very high rating · Strong review volume · Guest Favorite badge
Highlights: Top 5% of homes · Self check-in · Extra spacious
Potential gaps vs this comp
Missing vs comp: Air conditioning, BBQ grill, Indoor fireplace, Pack ’n play/Travel crib
Your advantages: Pool
Real review snippets from this comp
“Great place to stay. Close to all the local attractions, shopping, and restaurants. Perfect place for a short or long stay. Fully equipped with everything you need and even with i”
“Highly recommend!! 😊 Super clean, very comfortable beds, great water pressure, a nice pool area and neighborhood, and a perfect location. They allowed early check-in, and the snack”
Top Comp #2
distance=1.9mi
80.0
Outperform Score
fit 30.4 · trust 30.0
Guest favorite, Superhost
Badges
Price delta unavailable
Price vs You
Description
502 words, clarity 16/25, location cues 3, trust cues 0.
Why it likely wins
Very high rating · Strong review volume · Guest Favorite badge
Highlights: Top 5% of homes · Self check-in · Extra spacious
Potential gaps vs this comp
Missing vs comp: Central air conditioning, Crib, Dedicated workspace, EV charger - level 2
Your advantages: Pool
Real review snippets from this comp
“We really enjoyed our stay especially after long days at the theme parks. It was so nice to come back to the Melia’s pool and The Wilson restaurant a huge plus. Everything was clea”
“We had a great stay and Eric was very responsive to any and all questions we had! We thoroughly enjoyed the space and balcony, and our pups had the best trip! Between a cheer com”
Top Comp #3
distance=0.8mi
79.2
Outperform Score
fit 29.6 · trust 27.0
Guest favorite, Superhost
Badges
Price delta unavailable
Price vs You
Description
494 words, clarity 21/25, location cues 3, trust cues 0.
Why it likely wins
Strong review volume · Guest Favorite badge · Superhost badge
Highlights: Top 10% of homes · At-home gym · Self check-in
Potential gaps vs this comp
Missing vs comp: BBQ grill, Central air conditioning, Crib, Dedicated workspace
Your advantages: Pets allowed, Pool
Real review snippets from this comp
“Me and my family had an amazing stay with zero complications. This Airbnb was such a great find! It was clean, cozy, and had everything we needed for a comfortable stay. The locati”
“We loved our stay here! The place was spotless and very well maintained. We especially enjoyed the hot tub, outdoor space, and the layout of the townhome, which worked perfectly fo”
Top Comp #4
distance=1.0mi
61.4
Outperform Score
fit 28.0 · trust 15.0
Price delta unavailable
Price vs You
Description
136 words, clarity 14/25, location cues 1, trust cues 0.
Why it likely wins
Strong review volume · Superhost badge · Broader amenity set
Highlights: Self check-in · Extra spacious · Monica Fabrichini is a Superhost
Potential gaps vs this comp
Missing vs comp: Air conditioning, BBQ grill, Crib, Dedicated workspace
Your advantages: Pets allowed
Real review snippets from this comp
“My family and I had a wonderful time staying here. We traveled for a graduation trip and wanted something with more space than a typical hotel and this place delivered! It’s close ”
“Monica was a fantastic host, responding quickly and being very clear in her directions. the property was well maintained and had great features included. highly recommend!”
Top Comp #5
distance=1.2mi
60.6
Outperform Score
fit 29.2 · trust 10.0
Price delta unavailable
Price vs You
Description
540 words, clarity 19/25, location cues 7, trust cues 0.
Why it likely wins
Strong review volume · Broader amenity set
Highlights: Self check-in · Comfy bed for better sleep · Lots to do nearby
Potential gaps vs this comp
Missing vs comp: Central air conditioning, EV charger - level 2, Folding or convertible high chair - always at the listing, Lake view
Your advantages: Pool
Real review snippets from this comp
“This was a wonderful getaway home for our vacation. We felt very comfortable and at home here. The water park was within walking distance and the water park staff were amazing an”
“This was the perfect rental for our family trip. We really enjoyed our stay and felt comfortable. The bedrooms were very clean and well kept. I am very pleased with this pick! The ”
What this market appears to reward
- 3/5 top comps carry a Guest Favorite badge
- 4/5 top comps carry Superhost status
- Top comps average 4.86 stars across 127 reviews
- Location and walkability language appears repeatedly across the strongest comps
- High-value amenities look like a meaningful separator in this market
Why these comps may be outperforming
- Top comps consistently use stronger location framing
- Several top comps appear stronger on amenity breadth
- The best-ranked comps pair high social proof with strong relevance, not just higher prices
How to use this page
Treat these as the five most relevant listings to beat on clarity, trust, and amenity breadth, not proof of actual occupancy. The goal is to spot repeatable conversion signals and close the obvious gaps.
BnBRx
Your listing, diagnosed.
85
Overall Score - Grade B
Cozy Studio · Pool + Gym + Park | Central FL
Listing SAMPLE001
Generated April 17, 2026
Scores are directional decision support, not guarantees.
Date ranges materially affect comp and pricing sub-scores.